Today I’m pleased to share a post that was co-written with Dan Heilbron, Head of Customer Experience Advisory Services, Asia-Pacific and Japan at Qualtrics.
A relatively simple way of deriving insight from customer feedback is through correlation analysis.
Correlation analysis is a statistical technique that aims to establish whether a pair of variables could be related. It is used for spotting patterns within datasets. From a CX Manager’s perspective, the technique can be incredibly helpful to understand which independent variables (such as satisfaction driver questions in a voice of customer survey) could be influencing a dependant variable (such as a specific key metric like an NPS score or an operational metric like call hold times).
It is important, however, to note that while correlation analysis will help you to determine whether a statistical relationship exists between an independent variable and a dependant variable, and the strength of this relationship, it will not prove causation – i.e. that one event caused another event to occur. It will also not tell you the exact impact of the independent variable on the dependant variable.
To illustrate this point, let’s consider the CX Manager of an airport who discovers a correlation between the number of people slipping over in the airport foyer and the number of complaints about cancelled flights. Intuitively you’d say there’s no causal relationship between the two and you’d be right. What’s missing is a third variable which explains both: the presence of rain. Water on peoples’ shoes causes them to slip over in the foyer. Rainclouds also cause flights to be cancelled which leads to more complaints from customers.
When conducting correlation analysis, the strength of the relationship between the two variables being analysed is measured using a correlation coefficient (usually displayed as r) which will range between -1 and 1. A positive correlation means that both variables increase in relation to each other, while a negative correlation means that as one variable decreases, the other increases. A correlation of 0 means that there is no relationship between the two variables at all. The closer to 1 or -1 r is, the stronger the relationship between the two variables.
As with any statistical analysis technique, there are some downsides to correlation analysis:
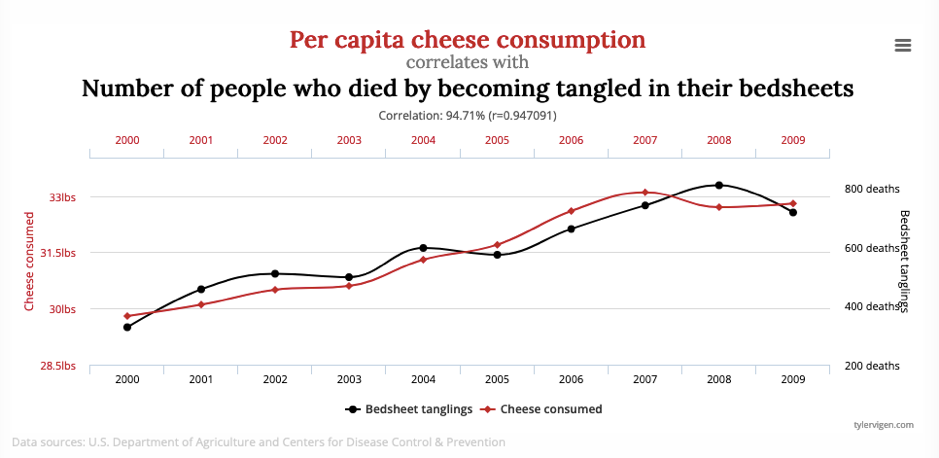
An r value of .947 is very high but of course in this case, it’s pure coincidence. The variables are completely unrelated; one does not cause the other. More “spurious correlations” like this can be found here.
It needs to start with a pre-defined set of variables. Managers need to select the variables that they will be testing prior to beginning the analysis. It will not identify the variable(s) that may be the real issue if they’re not part of the initial set.
Let’s illustrate how it’s done using an example. This time the manager of a contact centre wants to study the relationship between Average Hold Time (the independent variable) and NPS scores (the dependant variable) to ascertain if the time a customer spends on hold is related to their NPS score.
Here’s some sample data:
| Average Hold Time (secs) |
NPS score |
|
124 |
6 |
|
60 |
8 |
|
34 |
9 |
|
322 |
3 |
|
97 |
6 |
|
77 |
7 |
|
15 |
10 |
|
178 |
5 |
|
37 |
8 |
|
69 |
6 |
|
154 |
5 |
|
22 |
9 |
|
71 |
8 |
|
297 |
1 |
|
54 |
7 |
| 83 |
6 |
In this example r = -0.92777 – a strong negative correlation showing that when hold times went up, NPS scores went down. In other words, it is highly likely that the longer a customer spends on hold, the worse their perception of the experience would be and the less likely they would be to recommend the organisation.
Correlation analysis is not just the domain of people with degrees in statistics. It is a useful tool that all CX Managers have at their disposal to help them draw insights from feedback data. Its relatively easy to understand and doesn’t need expensive software to run. Just make sure you’re studying actionable variables and be careful not to jump to conclusions when looking at your results!
About My Co-Author

Dan Heilbron, CCXP leads Qualtrics‘ APJ CX advisory team and is based in Melbourne, Australia. Dan spends his time helping clients across the APJ region to maximise value from the strategic, cultural and VOC program design elements of their XM program, and to ensure their program evolves as their business goals and customer needs evolve. Prior to joining Qualtrics, Dan worked with other large XM SaaS organizations in Australia, the UK and the USA and has provided XM advisory services to Fortune 100 and exchange listed clients, government and not-for-profit entities across 5 continents, in industries such as sport and entertainment, automotive, airlines, hospitality, retail, B2B, financial services and healthcare.
Image courtesy of UnSplash.
I'm going to get straight to the point: a CX strategy that isn't tied to the achievement of organisational goals isn't
....READ MORE
I recently had the honour of speaking with Annette Franz, Founder and CEO of CX Journey, about her latest book, Employee Understanding.
....READ MORE
I recently had the honour of speaking with Annette Franz, Founder and CEO of CX Journey, about her latest book, Employee Understanding.
....READ MORE
